High Dividend Yield Stocks: When a Big Number Is a Warning
A stock flashing a 12% dividend yield sounds like free money, but that number often tells a very different story once you look closer.
Why a High Yield Can Mean the Opposite of Safety
Dividend yield is calculated by dividing the annual dividend per share by the current stock price. That formula contains a hidden trap. When a company's share price falls sharply, the yield rises automatically, even if the dividend itself has not changed at all.
Say a stock paid $2 per share annually when it traded at $40. That is a 5% yield. If bad news drives the price down to $20, the calculated yield jumps to 10%. The dividend has not improved. The business has deteriorated. Chasing that 10% without understanding why the price dropped is how investors walk into value traps.
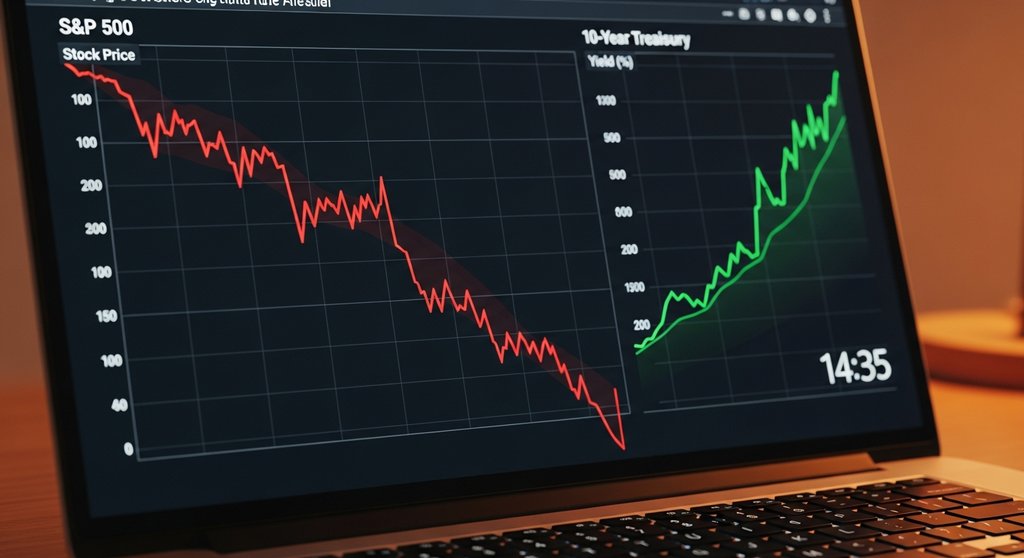
What a 'Normal' Yield Looks Like Right Now
With the Federal Reserve holding benchmark rates above 5% through much of 2024, income investors finally had a real alternative in Treasury bonds and money-market funds. That shifted the threshold for what counts as a competitive dividend yield. A 3% yield that looked attractive in 2021 feels modest compared to a risk-free 5% T-bill. Try the dividend yield calculator to see your own numbers.
Historically, the S&P 500's average dividend yield has hovered between 1.5% and 2.5% over the past decade. Utilities and real-estate investment trusts often sit in the 3% to 5% range. Anything above 7% or 8% in a stable sector deserves serious scrutiny. The market is rarely leaving money on the table.
Use a dividend yield calculator to run quick comparisons across several tickers before you commit. Plugging in current price and annual dividend in seconds stops you from relying on stale figures quoted on financial news sites, which sometimes lag actual distributions by months.
The Payout Ratio Is the Number Yield Ignores
Yield alone tells you nothing about sustainability. The payout ratio, which is dividends paid divided by net earnings, is the missing piece. A company earning $1 per share and paying $0.90 of that as dividends has a 90% payout ratio. One rough quarter could force a cut, and a dividend cut almost always sends the share price lower, compounding the investor's loss.
A more comfortable threshold is a payout ratio below 60% for most industrial and consumer companies. REITs and utilities operate under different rules because of their capital structures, so they can sustain higher ratios, but even there you want earnings coverage. If a company is paying out more than it earns for multiple quarters, the yield is borrowed time.
A Quick Worked Example Before You Buy
Take a hypothetical telecom stock trading at $18 with a declared annual dividend of $1.44 per share. Yield is $1.44 divided by $18, or exactly 8%. That sounds appealing. But if the company earned $1.20 per share last year, the payout ratio is 120%. It paid out more than it earned. That dividend is almost certainly going to be cut or eliminated.
Now compare that to a consumer-staples company at $55 a share paying $1.65 annually. Yield is just 3%, which feels unexciting. But if earnings are $3.80 per share, the payout ratio is a comfortable 43%. That dividend has room to grow, and the price is less likely to crater on a single bad earnings report.
Running these numbers takes less than a minute with a dedicated dividend yield calculator. The math is simple; the discipline of actually doing it before buying is what separates patient income investors from people who keep wondering why their 'high-yield' portfolio keeps shrinking.