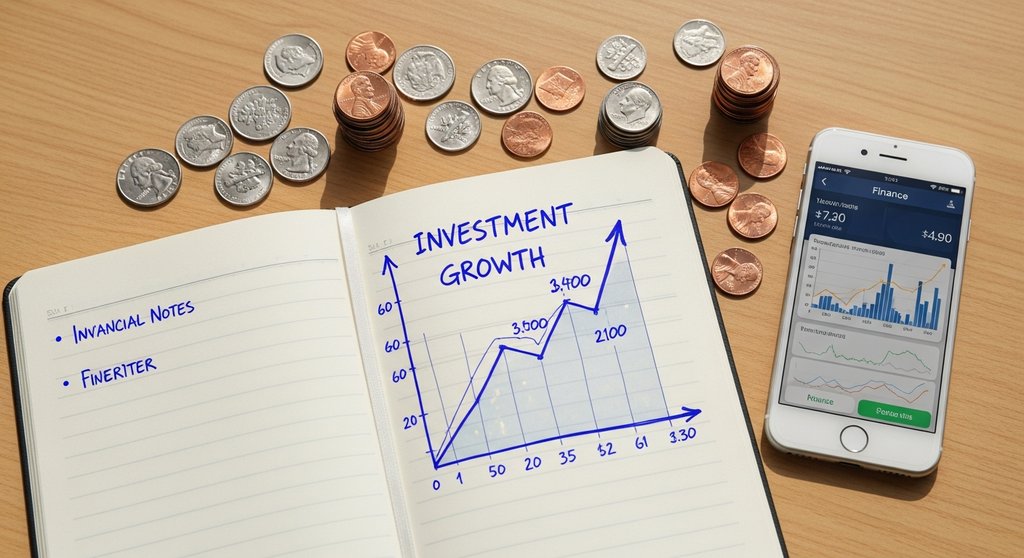
Does DCA Actually Beat Lump Sum Investing?
Most people assume spreading purchases over time is the smart, safe move, but decades of market data suggest lump sum investing beats dollar cost averaging roughly two-thirds of the time.
Why DCA Feels Right Even When It Underperforms
Dollar cost averaging, buying a fixed dollar amount on a regular schedule regardless of price, is emotionally comfortable. You buy more shares when prices drop and fewer when they rise, which feels disciplined. The problem is that markets trend upward over long periods, so money sitting in cash waiting for its scheduled investment date is usually missing gains.
A 2012 Vanguard study analyzed 12-month rolling windows across the US, UK, and Australian markets and found lump sum investing outperformed DCA about 66% of the time. The average outperformance was roughly 2.3 percentage points. That gap is not trivial over a 20 or 30-year horizon.
The One Scenario Where DCA Genuinely Wins
DCA earns its reputation in sideways or falling markets. If you had invested a lump sum in January 2000 right before the dot-com crash, you would have watched your portfolio drop nearly 50% and waited until 2007 to break even. Someone buying monthly through that same period accumulated shares at progressively lower prices and recovered far faster. Try the dollar cost averaging calculator to see your own numbers.
This is where psychology matters as much as math. An investor who panic-sells a lump sum during a 30% drawdown ends up worse than someone who kept buying through DCA and never saw a single catastrophic-looking account balance. The strategy you actually stick with is the one that works. For most people, DCA is a behavioral guardrail as much as a financial strategy.
DCA also wins by default when you have no lump sum to invest. Regular contributions from a paycheck, like a 401(k) deduction, are DCA in practice. In that context, the debate is moot; the question becomes how to optimize the schedule and amount, not whether to do it at all.
Running the Numbers on a $500 Monthly Plan
Take a straightforward example. You invest $500 per month into a broad index fund for 10 years. Assuming a 7% average annual return, you contribute $60,000 total. A dollar cost averaging calculator shows that portfolio growing to roughly $86,500, a gain of about $26,500 purely from compounding and market growth on staggered purchases.
Change the assumption to a 4% average return, which is closer to a conservative bond-heavy allocation, and the ending balance drops to around $73,700. The gap between a 4% and 7% scenario over a decade is more than $12,000 on the same contributions. That spread makes asset allocation decisions at least as important as the contribution schedule itself.
Plugging different contribution amounts, time horizons, and expected return rates into a dollar cost averaging calculator makes these comparisons concrete instead of abstract. Seeing a specific projected balance often does more to motivate consistent investing than any general advice about starting early.
Adjusting Your DCA Strategy in a High-Rate Environment
With short-term interest rates still meaningfully above zero, the opportunity cost of holding cash between lump sum investments is smaller than it was in 2021. A high-yield savings account or money market fund can earn 4% to 5% annually while you stage purchases over a few months. That changes the lump sum vs. DCA calculus slightly in favor of a short-term hybrid approach.
One reasonable tactic is to split a windfall into three to six equal monthly purchases rather than twelve. You reduce the drag of cash sitting idle while still smoothing your entry price. This is not a guaranteed edge, but it balances the statistical advantage of lump sum investing against real sequence-of-returns risk, especially if you are investing close to a major goal like retirement.