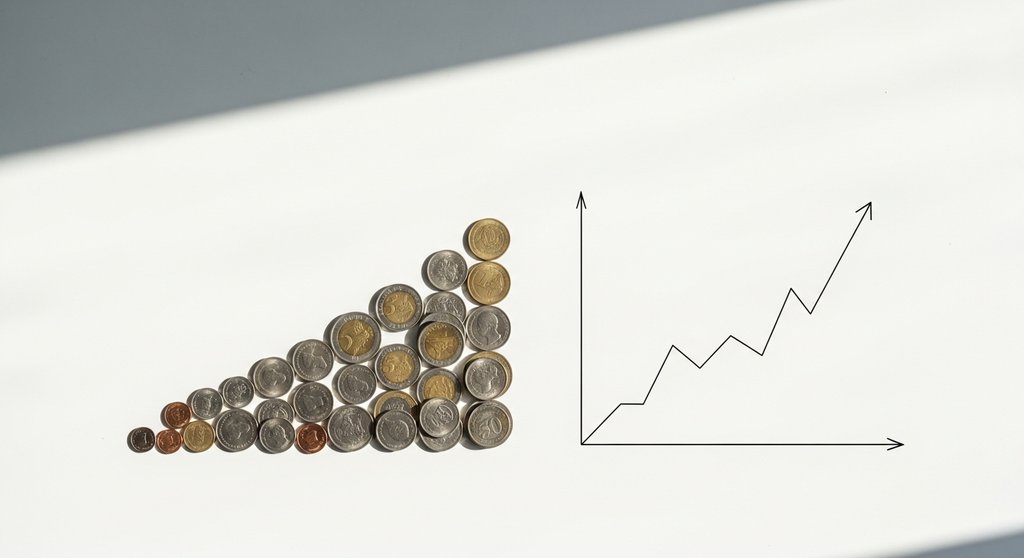
Does Dollar Cost Averaging Actually Beat Lump Sum Investing?
Dollar cost averaging has a reputation as the safe, smart move, but the research behind it is more complicated than most financial content lets on.
What the Vanguard Study Actually Found
A widely cited Vanguard study tracked lump sum investing against dollar cost averaging across rolling 10-year windows in the US, UK, and Australian markets. Lump sum won about two-thirds of the time. The reason is straightforward: markets trend upward over long periods, so money sitting on the sidelines waiting to be deployed tends to grow more slowly than money already in the market.
That finding surprises a lot of people because DCA is usually framed as the obviously smarter strategy. The nuance is that DCA wins when markets fall significantly right after you invest, which feels likely but is statistically less common than a market that just keeps climbing.
When DCA Earns Its Reputation and When It Doesn't
DCA genuinely shines in two situations. First, when you receive income in regular paychecks and simply invest each month as money arrives, you are not really choosing between DCA and lump sum. You are just investing what you have. Second, if you have a large windfall and strong psychological anxiety about timing the market, DCA reduces the risk of investing everything right before a crash, even if it statistically costs you a small amount of expected return. Try the dollar cost averaging calculator to see your own numbers.
Where DCA quietly underperforms is when investors treat it as a way to delay a decision indefinitely. Spreading a $50,000 inheritance over 24 months means roughly $25,000 sits in cash for an average of a year. At a 7% average annual return, that idle cash could miss around $1,750 in growth. That is not a disaster, but it is real money being left on the table in exchange for psychological comfort.
The best use of a dollar cost averaging calculator is to run both scenarios with your actual numbers, your time horizon, your expected contribution schedule, and your assumed rate of return, so you can see the projected gap before committing to a plan.
Running the Numbers on a Real Scenario
Say you have $12,000 to invest and you decide to put in $1,000 per month for a year. With a 7% annualized return, your average dollar is in the market for about six months instead of twelve. That single year costs you roughly $420 in foregone returns compared to investing everything on day one. Small, yes, but extrapolate that behavior across a career of receiving bonuses and tax refunds and sitting on them for months before acting, and the compounding cost gets meaningful.
A practical middle ground that many advisors recommend: invest half immediately and spread the rest over three to four months. You capture most of the statistical upside of lump sum investing while keeping a psychological buffer if the market drops sharply in the first weeks. Plugging this hybrid approach into a dollar cost averaging calculator lets you compare it against both extremes with your exact figures.
Why the Current Rate Environment Changes the Calculus Slightly
High-yield savings accounts and money market funds currently pay around 4.5 to 5 percent. That changes the DCA equation a little. Cash sitting on the sidelines during a 12-month DCA schedule is no longer completely idle; it earns a real yield. This narrows the performance gap between DCA and lump sum compared to the low-rate era when cash earned essentially nothing.
Still, 4.5% in a money market versus a historical equity return closer to 7 to 10% means equities still hold the statistical edge on average. The gap just shrinks from about $840 on that $12,000 example down to roughly $480 when you account for earned interest on the uninvested portion. It is worth modeling this with your own numbers rather than relying on averages.